Multiple Choice
The following figure shows the demand curve, the marginal revenue (MR) curve, the marginal cost (MC) curve, and the average total cost (ATC) curve of a monopolist.
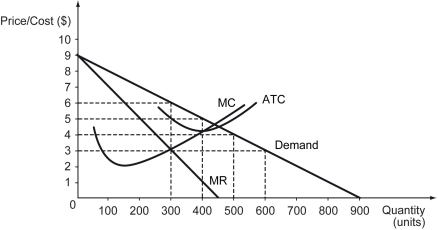
-Refer to the figure above.What is the profit-maximizing quantity for the monopolist?
A) 300 units
B) 400 units
C) 500 units
D) 550 units
Correct Answer:

Verified
Correct Answer:
Verified
Q41: Scenario: Mr. Olivander has a monopoly on
Q42: Scenario: Tobac Co. is a monopolist in
Q43: Under fair-returns price regulation,_.<br>A) deadweight loss is
Q44: The following figure represents the cost and
Q45: An efficient price is a price set
Q47: What makes World's Fair of 1876,in Philadelphia
Q48: Perfect price discrimination occurs when a firm
Q49: The following figure shows the demand and
Q50: Which of the following is NOT an
Q51: What are the different types of price