Multiple Choice
The following figure shows the demand curve, the marginal revenue (MR) curve, the marginal cost (MC) curve, and the average total cost (ATC) curve of a monopolist.
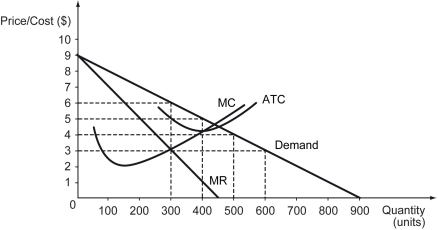
-Refer to the figure above.What is the profit-maximizing price for the monopolist?
A) $3
B) $4
C) $5
D) $6
Correct Answer:

Verified
Correct Answer:
Verified
Q101: Scenario: Tobac Co. is a monopolist in
Q102: Sellers in _ are likely to have
Q103: The following figure shows the costs and
Q104: Which of the following is NOT an
Q105: The following figure shows the demand (D),
Q107: The monopoly market structure is characterized by
Q108: The quantity effect of a price reduction
Q109: Over a particular price range,if the quantity
Q111: Over a particular price range,if the quantity
Q289: The figure below shows the cost and