menu-iconExamlexExamLexServices

Discover

Ask a Question
  1. All Topics
  2. Topic
    Business
  3. Study Set
    Principles of Economics
  4. Exam
    Exam 8: Application: the Costs of Taxation
  5. Question
    Use the Following Graph Shown to Fill in the Table
Solved

Use the Following Graph Shown to Fill in the Table

Question 23

Question 23

Essay

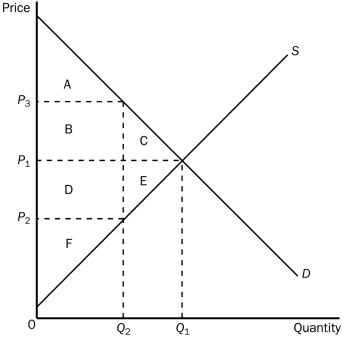
Use the following graph shown to fill in the table that follows.

Correct Answer:

verifed

Verified

Unlock this answer now
Get Access to more Verified Answers free of charge

Related Questions

Q13: Suppose a tax of $1 per unit

Q19: Figure 8-5<br> <img src="https://d2lvgg3v3hfg70.cloudfront.net/TB2178/.jpg" alt="Figure 8-5

Q20: When Ronald Reagan ran for the presidency

Q24: One negative aspect of Henry George's single

Q25: Consider a good to which a per-unit

Q25: To fully understand how taxes affect economic

Q27: Figure 8-2<br> <img src="https://d2lvgg3v3hfg70.cloudfront.net/TB2178/.jpg" alt="Figure 8-2

Q28: A tax on a good<br>A)raises the price

Q28: Figure 8-2<br> <img src="https://d2lvgg3v3hfg70.cloudfront.net/TB2178/.jpg" alt="Figure 8-2

Q203: Because taxes distort incentives, they cause markets

Examlex

ExamLex

About UsContact UsPerks CenterHomeschoolingTest Prep

Work With Us

Campus RepresentativeInfluencers

Links

FaqPricingChrome Extension

Download The App

Get App StoreGet Google Play

Policies

Privacy PolicyTerms of ServiceHonor CodeCommunity Guidelines

Scan To Download

qr-code

Copyright © (2025) ExamLex LLC.

Privacy PolicyTerms Of ServiceHonor CodeCommunity Guidelines