Essay
Construct a scatter diagram for the data.
-The scores of nine members of a local community college women's golf team in two rounds of tournament play are listed below. 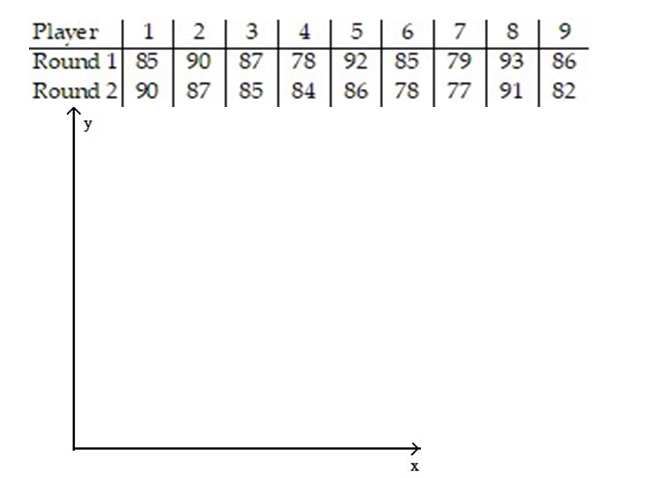
Correct Answer:

Verified
Correct Answer:
Verified
Related Questions
Q20: Calculate the linear correlation coefficient for the
Q21: Analyze the residual lot below. Does it
Q22: Compute the linear correlation coefficient between the
Q23: A county real estate appraiser wants to
Q24: The data below show the age and
Q26: In an area of Russia, records were
Q27: Is there a relationship between the raises
Q28: Civil engineers often use the straight-line equation,
Q29: Use the linear correlation coefficient given to
Q30: Is there a relationship between the raises