Multiple Choice
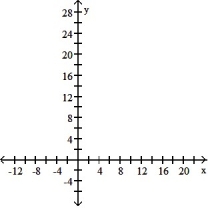
Make a scatter diagram for the data. Use the scatter diagram to describe how, if at all, the variables are related.
-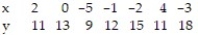
A) The variables do not appear to be linearly related. 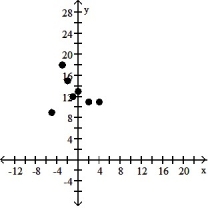
B) The variables appear to be positively, linearly related. 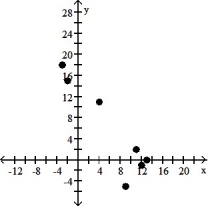
C) The variables do not appear to be linearly related. 
D) The variables appear to be negatively, linearly related. 
Correct Answer:

Verified
Correct Answer:
Verified
Q32: Calculate the linear correlation coefficient for the
Q33: Construct a scatter diagram for the data.<br>-The
Q34: The following data represent the living situation
Q35: The data below are the ages and
Q36: A large national bank charges local companies
Q38: A real estate magazine reported the results
Q39: Find the equation of the regression line
Q40: In a study of feeding behavior, zoologists
Q41: A calculus instructor is interested in finding
Q42: In a comprehensive road test on all