Essay
Construct a scatter diagram for the data.
-The data below are the temperatures on randomly chosen days during a summer class and the number of absences on those days. 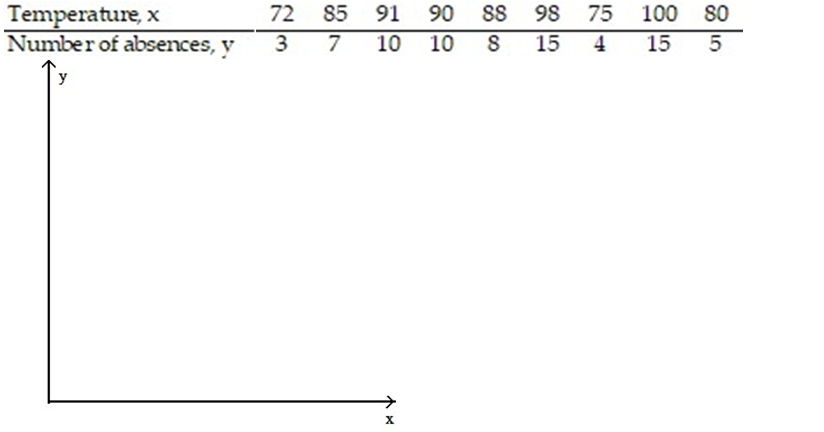
Correct Answer:

Verified
Correct Answer:
Verified
Related Questions
Q28: Civil engineers often use the straight-line equation,
Q29: Use the linear correlation coefficient given to
Q30: Is there a relationship between the raises
Q31: The table shows, for the years 1997-2012,
Q32: Calculate the linear correlation coefficient for the
Q34: The following data represent the living situation
Q35: The data below are the ages and
Q36: A large national bank charges local companies
Q37: Make a scatter diagram for the data.
Q38: A real estate magazine reported the results