Multiple Choice
A real estate magazine reported the results of a regression analysis designed to predict the price (y) , measured in dollars, of residential properties recently sold in a northern Virginia subdivision. One independent variable used to predict sale price is GLA, gross living area (x) , measured in square feet. Data for 157 properties were used to fit the model,  =
=  +
+  x. The results of the simple linear regression are provided below.
 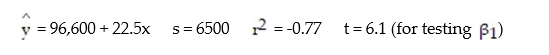 Interpret the estimate of
  , the y-intercept of the line.
A) For every 1-sq ft. increase in GLA, we expect a property's sale price to increase $96,600.
B) About 95% of the observed sale prices fall within $96,600 of the least squares line.
C) There is no practical interpretation, since a gross living area of 0 is a nonsensical value.
D) All residential properties in Virginia will sell for at least $96,600.
Correct Answer:

Verified
Correct Answer:
Verified
Q33: Construct a scatter diagram for the data.<br>-The
Q34: The following data represent the living situation
Q35: The data below are the ages and
Q36: A large national bank charges local companies
Q37: Make a scatter diagram for the data.
Q39: Find the equation of the regression line
Q40: In a study of feeding behavior, zoologists
Q41: A calculus instructor is interested in finding
Q42: In a comprehensive road test on all
Q43: The regression line for the given data