Essay
The table shows, for the years 1997-2012, the mean hourly wage for residents of the town of Pity Me and the mean weekly rent paid by the residents. 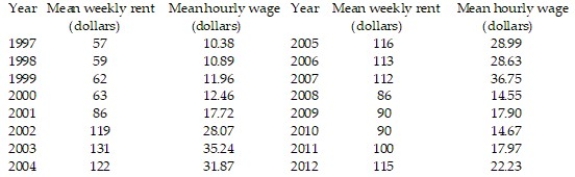 Summary statistics yield:
  = 1222.2771,
  = 3031.7125,
  = 9144.9375,
  = 21.2675, and
  Find the least squares line that uses mean hourly wage to predict mean weekly rent. Round values to the nearest ten-thousandth.
Correct Answer:

Verified
Correct Answer:
Verified
Q26: In an area of Russia, records were
Q27: Is there a relationship between the raises
Q28: Civil engineers often use the straight-line equation,
Q29: Use the linear correlation coefficient given to
Q30: Is there a relationship between the raises
Q32: Calculate the linear correlation coefficient for the
Q33: Construct a scatter diagram for the data.<br>-The
Q34: The following data represent the living situation
Q35: The data below are the ages and
Q36: A large national bank charges local companies