Multiple Choice
In a neurological study of the effect of environment on mental development, rats were randomly assigned to be raised in one of the four following test conditions: Impoverished (wire mesh cage - housed alone) , Standard (cage with other rats) , Enriched (cage with other rats and toys) , and Super Enriched (cage with other rats and toys changed on a periodic basis) . After two months, the rats were tested on a variety of learning measures, one of them being the number of attempts needed to learn to navigate a maze. The data for the maze task are below, along with means and standard deviation for each group. 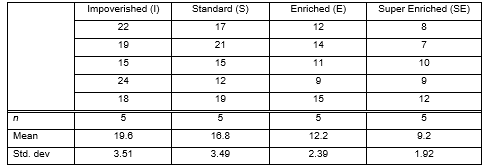
-A simulated null distribution of 1,000 Mean Group Diff statistics follows. 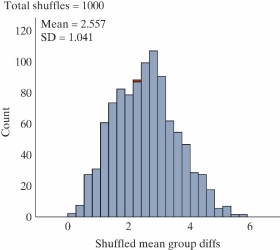 Describe how to use this distribution to calculate the p-value.
A) Count the proportion of samples less than or equal to 5.967.
B) Count the proportion of samples greater than or equal to 5.967.
C) Count the proportion of samples greater than or equal to 14.45.
D) Count the proportion of samples less than or equal to -5.967 and greater than or equal to 5.967.
Correct Answer:

Verified
Correct Answer:
Verified
Q8: The F statistic can be negative.
Q9: College students tested to see if how
Q10: As the size of the sample in
Q11: A British study examined whether the type
Q12: A British study examined whether the type
Q14: College students tested to see if how
Q15: Why do you do overall tests when
Q16: The two graphs, A and B, show
Q17: As the F statistic increases, the p-value
Q18: In a neurological study of the effect