Multiple Choice
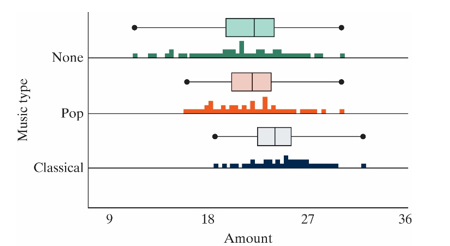
A British study examined whether the type of background music playing in a restaurant affected the amount of money that diners spent on their meals. The researchers asked a restaurant to alternate silence, popular music, and classical music on successive nights over eighteen days. Each type of music was played for 6 nights (the order was randomly determined to guard against confounding) . The type of music played and the amount spent on food and drinks (in British pounds) for each of 393 customers was recorded. The data are summarized below.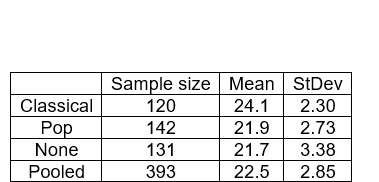
-The p-value for the ANOVA F-test is less than 0.001. How would you interpret this value?
A) In less than 0.1% of all samples, the F-statistic would be as large or larger than the one observed, assuming there is no association between music type and amount spent on food and drinks.
B) In less than 0.1% of all samples, the F-statistic would be as small or smaller than the one observed, assuming there is no association between music type and amount spent on food and drinks.
C) In less than 0.1% of all samples, the F-statistic would be as large or larger than the one observed, assuming there is an association between music type and amount spent on food and drinks.
D) In less than 0.1% of all samples, the F-statistic would be as small or smaller than the one observed, assuming there is an association between music type and amount spent on food and drinks.
Correct Answer:

Verified
Correct Answer:
Verified
Q7: What is the null hypothesis? Select all
Q8: The F statistic can be negative.
Q9: College students tested to see if how
Q10: As the size of the sample in
Q11: A British study examined whether the type
Q13: In a neurological study of the effect
Q14: College students tested to see if how
Q15: Why do you do overall tests when
Q16: The two graphs, A and B, show
Q17: As the F statistic increases, the p-value