Multiple Choice
The two graphs, A and B, show dotplots from two different data sets. Suppose I want to com-pare the means in A and do another comparison of means in B. For each case I compute a MAD statistic. Which of the following will be true about these statistics? 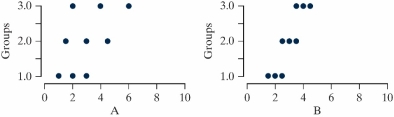
A) The MAD statistic is the same in A and B.
B) The MAD statistic is larger in A than in B.
C) The MAD statistic is smaller in A than in B.
D) We cannot tell if the MAD statistic will be larger in A or B.
Correct Answer:

Verified
Correct Answer:
Verified
Q11: A British study examined whether the type
Q12: A British study examined whether the type
Q13: In a neurological study of the effect
Q14: College students tested to see if how
Q15: Why do you do overall tests when
Q17: As the F statistic increases, the p-value
Q18: In a neurological study of the effect
Q19: The Mean Group Diff statistic cannot be
Q20: College students tested to see if how
Q21: As the Mean Group Diff statistic increases,