True/False
The plot below displays the on-base percentage for all Major League Baseball players who played in at least 15 games during the 2018 MLB season based on the player's position.
Positions: 1/2/3B = 1st/2nd/3rd base, C = catcher, C/L/RF = center/left/right field, DH = designated hitter, P = pitcher, SS = short stop
On-base percentage = (hits + walks + hit by pitch)/(total plate appearances) 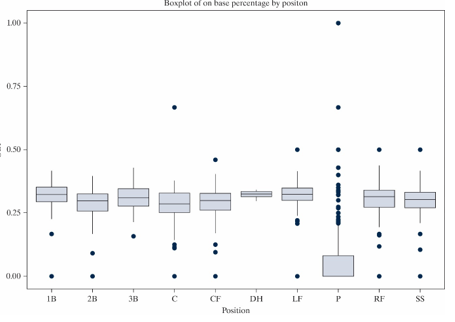
-At least 50% of on-base percentages for the pitcher (P) are zero.
Correct Answer:

Verified
Correct Answer:
Verified
Q4: Do children diagnosed with attention deficit/hyperactivity disorder
Q5: When newborns are held so that their
Q6: In order to investigate whether talking on
Q7: The boxplots below display the distribution of
Q8: The boxplots below display the distribution of
Q10: An article that appeared in the British
Q11: The boxplots below display the distribution of
Q12: Monthly snowfall (in inches) was measured over
Q13: In order to investigate whether talking on
Q14: Do children diagnosed with attention deficit/hyperactivity disorder