Multiple Choice
The boxplots below display the distribution of maximum speed by type of roller coaster for a data set of 145 roller coasters in the United States. 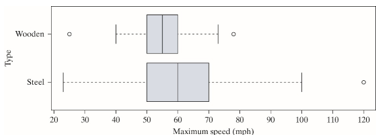
-For steel roller coasters, if the outlier at 120 was removed, the sample mean would
A) increase.
B) decrease.
C) stay the same.
D) There is not enough information given to know if the sample mean would change.
Correct Answer:

Verified
Correct Answer:
Verified
Q6: In order to investigate whether talking on
Q7: The boxplots below display the distribution of
Q8: The boxplots below display the distribution of
Q9: The plot below displays the on-base percentage
Q10: An article that appeared in the British
Q12: Monthly snowfall (in inches) was measured over
Q13: In order to investigate whether talking on
Q14: Do children diagnosed with attention deficit/hyperactivity disorder
Q15: In order to investigate whether talking on
Q16: Do children diagnosed with attention deficit/hyperactivity disorder