Multiple Choice
The boxplots below display the distribution of maximum speed by type of roller coaster for a data set of 145 roller coasters in the United States. 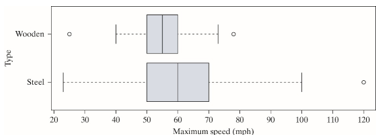
-The boxplots show that 25% of wooden roller coasters in the sample travel faster than
A) 50 mph.
B) 54 mph.
C) 60 mph
D) 65 mph.
Correct Answer:

Verified
Correct Answer:
Verified
Q3: Monthly snowfall (in inches) was measured over
Q4: Do children diagnosed with attention deficit/hyperactivity disorder
Q5: When newborns are held so that their
Q6: In order to investigate whether talking on
Q7: The boxplots below display the distribution of
Q9: The plot below displays the on-base percentage
Q10: An article that appeared in the British
Q11: The boxplots below display the distribution of
Q12: Monthly snowfall (in inches) was measured over
Q13: In order to investigate whether talking on