Multiple Choice
Suppose that a, b, c, and d are integers and that a is positive and even, b is positive and odd, c is negative and even, and d is negative and odd. Which of the following graphs could correspond to the power function  ? If none of the graphs correspond to the function, enter "none".C
A) 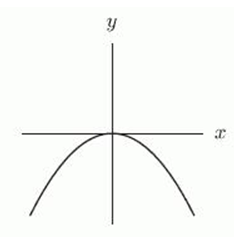
B) 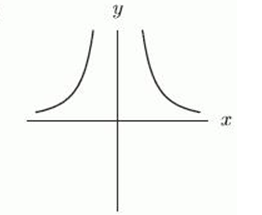
C) 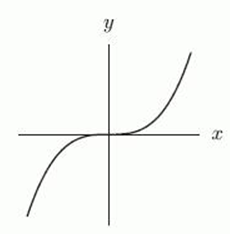
D) 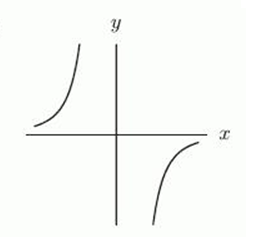
Correct Answer:

Verified
Correct Answer:
Verified
Q2: The figure below shows the graphs of
Q3: Let <img src="https://d2lvgg3v3hfg70.cloudfront.net/TB10073/.jpg" alt="Let be
Q4: A 14 kg sample of a certain
Q5: The following figure gives the graphs of
Q6: One of the following tables of data
Q7: Find a power function through the two
Q8: A 16 kg sample of a certain
Q9: Is <img src="https://d2lvgg3v3hfg70.cloudfront.net/TB10073/.jpg" alt="Is a
Q10: The following table represents the amount of
Q11: The formula for the power function whose