Multiple Choice
The following figure shows scatter plots with r values 0.9, 0.5, 0 ,-0.5, and -0.9. Which scatter plot has r value 0.5?
A) 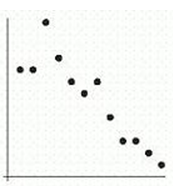
B) 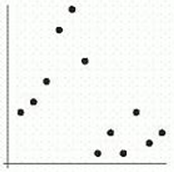
C) 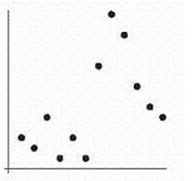
D) 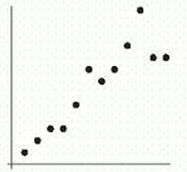
E) 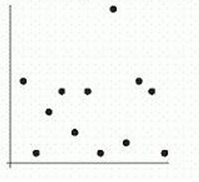
Correct Answer:

Verified
Correct Answer:
Verified
Related Questions
Q14: Let <img src="https://d2lvgg3v3hfg70.cloudfront.net/TB10073/.jpg" alt="Let be
Q15: A wildlife ranger finds that
Q16: The following table gives the profits (in
Q17: The following table shows the size of
Q18: The following table gives the profits (in
Q20: You are looking at a graph of
Q21: Let <img src="https://d2lvgg3v3hfg70.cloudfront.net/TB10073/.jpg" alt="Let
Q22: Mark all of the following functions that
Q23: The table below gives the deer population
Q24: Suppose there are 120 people living in