Short Answer
The following table shows the size of a cell phone bill, in dollars, as a function of the number of text messages.
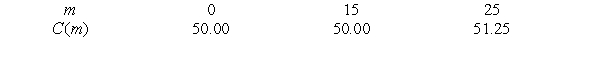
- Use a calculator program to find a regression line for this data. Estimate

using the formula for the regression line.
Correct Answer:

Verified
Correct Answer:
Verified
Q12: What could the following graph reasonably represent?<br><img
Q13: Mark all of the following functions that
Q14: Let <img src="https://d2lvgg3v3hfg70.cloudfront.net/TB10073/.jpg" alt="Let be
Q15: A wildlife ranger finds that
Q16: The following table gives the profits (in
Q18: The following table gives the profits (in
Q19: The following figure shows scatter plots with
Q20: You are looking at a graph of
Q21: Let <img src="https://d2lvgg3v3hfg70.cloudfront.net/TB10073/.jpg" alt="Let
Q22: Mark all of the following functions that