Short Answer
The following table gives the profits (in millions) of a manufacturing company
 months after January 1, 2008.
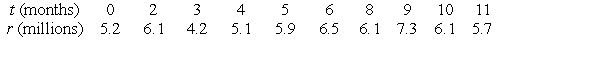
- Use a calculator program to find the vertical intercept of the regression line for this data. Round to 2 decimal places.
Correct Answer:

Verified
Correct Answer:
Verified
Q11: The following table gives the number of
Q12: What could the following graph reasonably represent?<br><img
Q13: Mark all of the following functions that
Q14: Let <img src="https://d2lvgg3v3hfg70.cloudfront.net/TB10073/.jpg" alt="Let be
Q15: A wildlife ranger finds that
Q17: The following table shows the size of
Q18: The following table gives the profits (in
Q19: The following figure shows scatter plots with
Q20: You are looking at a graph of
Q21: Let <img src="https://d2lvgg3v3hfg70.cloudfront.net/TB10073/.jpg" alt="Let