Short Answer
The following table gives the number of people P living in a town t years after 1990.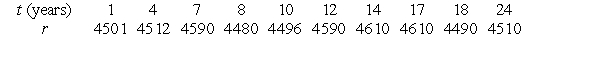 Use a calculator program to find the regression line for this data.
Correct Answer:

Verified
Correct Answer:
Verified
Related Questions
Q6: Does the following graph give y as
Q7: Mark all of the following functions that
Q8: What is the vertical intercept of the
Q9: Suppose there are 120 people living in
Q10: Find a formula for the linear function
Q12: What could the following graph reasonably represent?<br><img
Q13: Mark all of the following functions that
Q14: Let <img src="https://d2lvgg3v3hfg70.cloudfront.net/TB10073/.jpg" alt="Let be
Q15: A wildlife ranger finds that
Q16: The following table gives the profits (in