Multiple Choice
What could the following graph reasonably represent?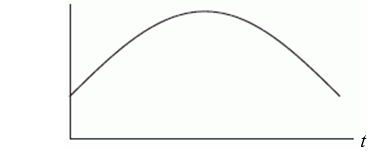
A) The average daily temperature of Chicago over a one-year time period with t = 0 being July 1.
B) The average daily temperature of Chicago over a one-year time period with t = 0 being January 1.
C) The population of Chicago between 1900 and 2000 with t = 0 being 1900.
D) The infant mortality rate in Chicago between 1900 and 2000 with t = 0 being 1900.
Correct Answer:

Verified
Correct Answer:
Verified
Q7: Mark all of the following functions that
Q8: What is the vertical intercept of the
Q9: Suppose there are 120 people living in
Q10: Find a formula for the linear function
Q11: The following table gives the number of
Q13: Mark all of the following functions that
Q14: Let <img src="https://d2lvgg3v3hfg70.cloudfront.net/TB10073/.jpg" alt="Let be
Q15: A wildlife ranger finds that
Q16: The following table gives the profits (in
Q17: The following table shows the size of