Multiple Choice
The graph below displays the population of the Madison, WI by decade.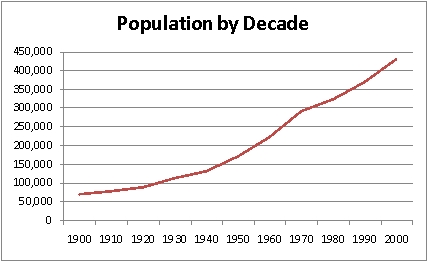
What would the units of the rate of change be?
A) People per thousand
B) Years per person
C) People per year
D) Years per thousand
Correct Answer:

Verified
Correct Answer:
Verified
Related Questions
Q171: Graph the function <img src="https://d2lvgg3v3hfg70.cloudfront.net/TB9987/.jpg" alt="Graph the
Q172: Find the value of y that satisfies
Q173: Find the value of y such that
Q174: Create an estimate of a linear model
Q175: Which function pictured has the largest slope?<br><img
Q177: The following table gives information about the
Q178: Find a linear equation that describes the
Q179: Find the equation of the line for
Q180: Assuming that the line through the given
Q181: Find the equation of the line through