Essay
The following table gives information about the population of Barron County by decade.
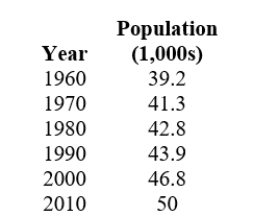
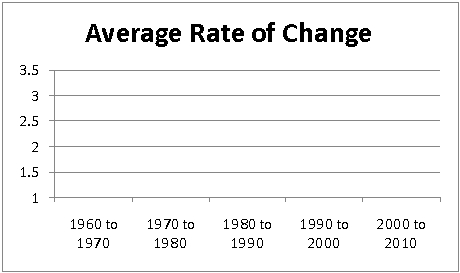
Construct a graph of the average rate of change by decade.
Correct Answer:

Verified
Correct Answer:
Verified
Related Questions
Q172: Find the value of y that satisfies
Q173: Find the value of y such that
Q174: Create an estimate of a linear model
Q175: Which function pictured has the largest slope?<br><img
Q176: The graph below displays the population of
Q178: Find a linear equation that describes the
Q179: Find the equation of the line for
Q180: Assuming that the line through the given
Q181: Find the equation of the line through
Q182: Put this equation into slope-intercept form.<br>24x +