Related Questions
Q167: State whether the data shown in the
Q168: Find the slope of the line through
Q169: Find the slope of the line shown.<br>
Q170: Use the function given to evaluate <img
Q171: Graph the function <img src="https://d2lvgg3v3hfg70.cloudfront.net/TB9987/.jpg" alt="Graph the
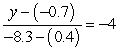
Q173: Find the value of y such that
Q174: Create an estimate of a linear model
Q175: Which function pictured has the largest slope?<br><img
Q176: The graph below displays the population of
Q177: The following table gives information about the