Multiple Choice
Solve the problem.
-The graph depicts a relationship between scores achieved on an unspecified standardized test and family income. Find the slope of the line.
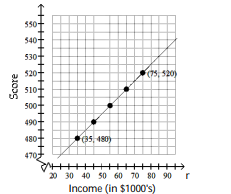
A) 1 point(s) per thousand dollars
B) 1000 point(s) per thousand dollars
C) 100 point(s) per thousand dollars
D) 10.1 point(s) per thousand dollars 
Correct Answer:

Verified
Correct Answer:
Verified
Q332: Solve the problem.<br>-Suppose that the speed of
Q333: Find the slope of the line.<br>-2y =
Q334: Answer the question<br>-The graph of the equation
Q335: Complete the table of values for the
Q336: Solve the problem<br>-A cable TV company charges
Q337: Evaluate the function.<br>-Given f(x) = - x
Q338: Solve the problem.<br>-This chart shows the fees
Q339: Tell whether or not the relation is
Q340: Solve the problem<br>-(2, 3), undefined slope<br><img src="https://d2lvgg3v3hfg70.cloudfront.net/TB9570/.jpg"
Q341: Answer the question<br>-The graph of the equation