Multiple Choice
Solve the problem.
-This chart shows the number of meals served in a restaurant during each of the past 4 months. Assume that the information in the chart defines a function with the name g. State the range of g.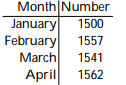
A) 
B) 
C) 
D) 
Correct Answer:

Verified
Correct Answer:
Verified
Related Questions
Q287: Find the intercepts for the graph of
Q288: Solve the problem.<br>-Suppose that during a certain
Q289: Solve the problem.<br>-The graph shows the sales
Q290: Decide whether the equation defines y as
Q291: State whether the graph is or is
Q293: Use the geometric interpretation of slope (rise
Q294: The table shown was generated by a
Q295: Complete the table of values for the
Q296: Plot the ordered pairs on the rectangular
Q297: Find an equation in slope-intercept form of