Multiple Choice
The table shown was generated by a graphics calculator. The expression y1 represents f(x) .
-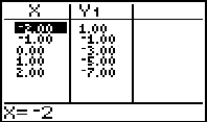
If f(x) = -7, then x = ?
A) -2
B) 0
C) 2
D) Cannot be determined
Correct Answer:

Verified
Correct Answer:
Verified
Related Questions
Q289: Solve the problem.<br>-The graph shows the sales
Q290: Decide whether the equation defines y as
Q291: State whether the graph is or is
Q292: Solve the problem.<br>-This chart shows the number
Q293: Use the geometric interpretation of slope (rise
Q295: Complete the table of values for the
Q296: Plot the ordered pairs on the rectangular
Q297: Find an equation in slope-intercept form of
Q298: Solve the problem<br>-(6, 6) , m =
Q299: Give the ordered pairs for the points