Multiple Choice
Which of the following figures shows the graph of a person's weight, , as a function of time , in months if the person starts out at 150 pounds and loses 5 pounds a month?
A) 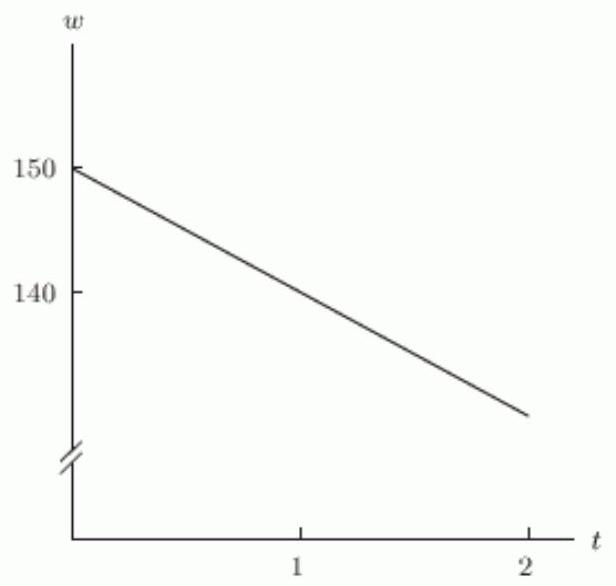
B) 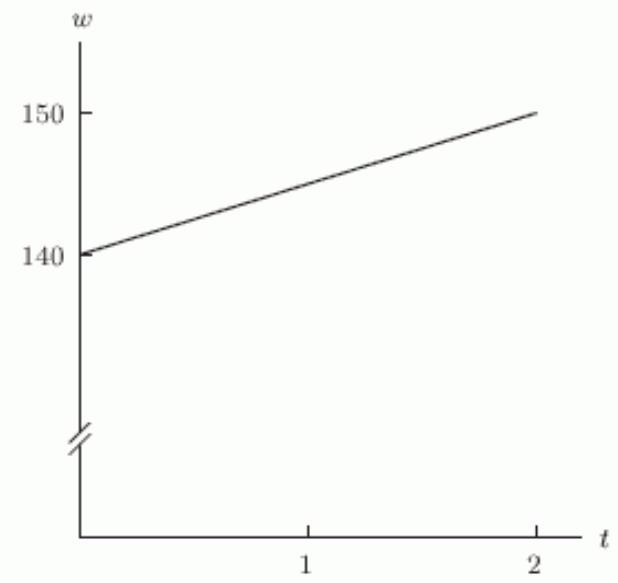
C) 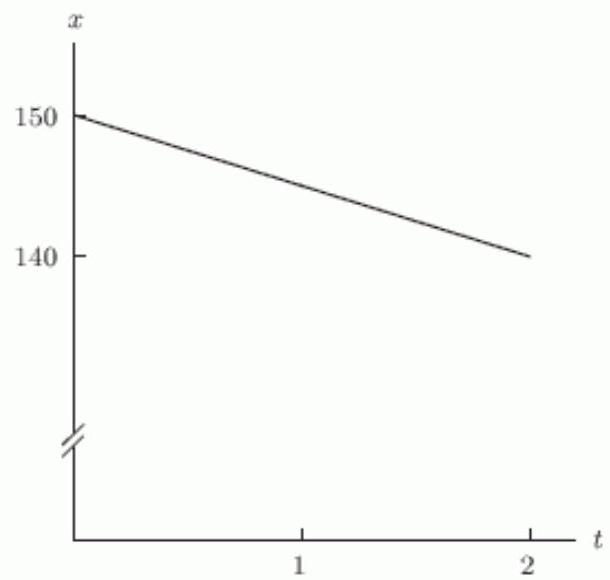
D) 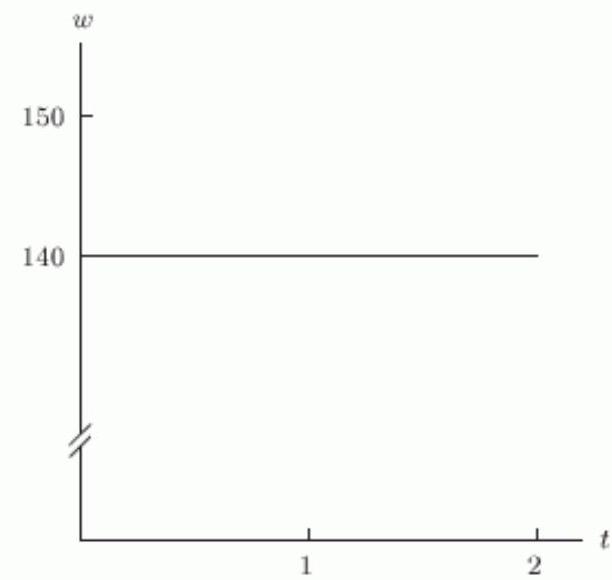
Correct Answer:

Verified
Correct Answer:
Verified
Related Questions
Q8: ComElectric, the Cambridge power company, charges
Q9: Let <span class="ql-formula" data-value="y=p(x)"><span class="katex"><span
Q10: The following tables give the profits
Q11: The table below gives the deer population
Q12: A cookie store has a fixed
Q14: Suppose there are 100 people living in
Q15: What could the following graph reasonably
Q16: If <span class="ql-formula" data-value="f(x)"><span class="katex"><span
Q17: The following figure show the distance of
Q18: At a price of <span