Multiple Choice
Use the circle graph to solve the problem.
-A survey of the 3356 vehicles on the campus of State University yielded the following circle graph.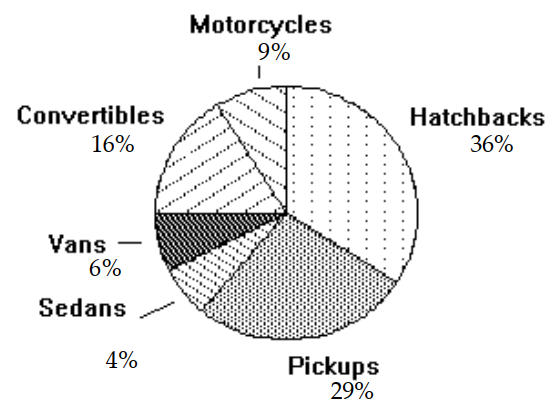
Together, what percent of the vehicles are either vans or convertibles?
A)
B)
C)
D)
Correct Answer:

Verified
Correct Answer:
Verified
Related Questions
Q140: The bar graph below shows the
Q141: The bar graph below shows the number
Q142: Find the mean.<br>- <span class="ql-formula" data-value="1.6,6.8,8.5,2.8,4.7"><span
Q143: Refer to the double-bar graph below
Q144: The histogram shows the scores of each
Q146: The following table contains information about moons
Q147: Use the graph to answer the
Q148: Use the circle graph to solve the
Q149: The bar graph below shows the number
Q150: Make a line graph of the data