Multiple Choice
Use the graph to answer the question.
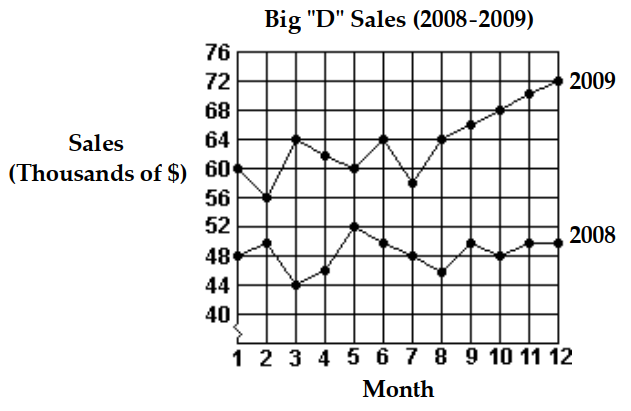
-What were the total sales for 2008?
A)
B)
C)
D)
Correct Answer:

Verified
Correct Answer:
Verified
Related Questions
Q142: Find the mean.<br>- <span class="ql-formula" data-value="1.6,6.8,8.5,2.8,4.7"><span
Q143: Refer to the double-bar graph below
Q144: The histogram shows the scores of each
Q145: Use the circle graph to solve
Q146: The following table contains information about moons
Q148: Use the circle graph to solve the
Q149: The bar graph below shows the number
Q150: Make a line graph of the data
Q151: The following stem-and-leaf plot gives the
Q152: Use the graph to answer the