Essay
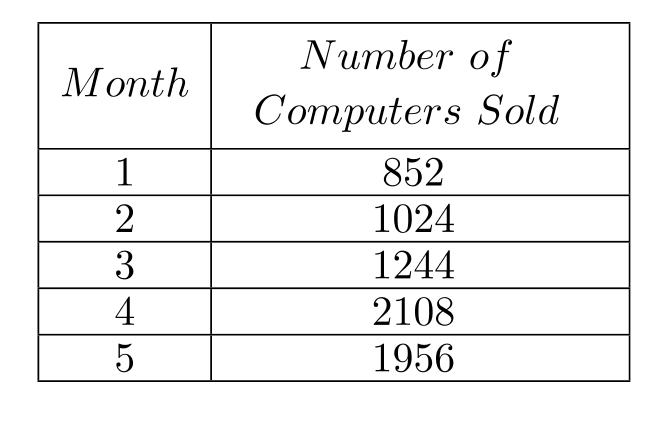
Make a line graph of the data in the table.
-The following table shows the number of computer sales made at Computer Buy over five months. Use time on the horizontal scale for your line graph.
Correct Answer:

Verified
Answers ma...View Answer
Unlock this answer now
Get Access to more Verified Answers free of charge
Correct Answer:
Verified
Answers ma...
View Answer
Unlock this answer now
Get Access to more Verified Answers free of charge
Related Questions
Q145: Use the circle graph to solve
Q146: The following table contains information about moons
Q147: Use the graph to answer the
Q148: Use the circle graph to solve the
Q149: The bar graph below shows the number
Q151: The following stem-and-leaf plot gives the
Q152: Use the graph to answer the
Q153: The bar graph below shows the number
Q154: Draw a tree diagram for the experiment.
Q155: A deck of cards contains 52