Multiple Choice
The bar graph below shows the number of students by major in the College of Arts and Sciences. Answer the question.
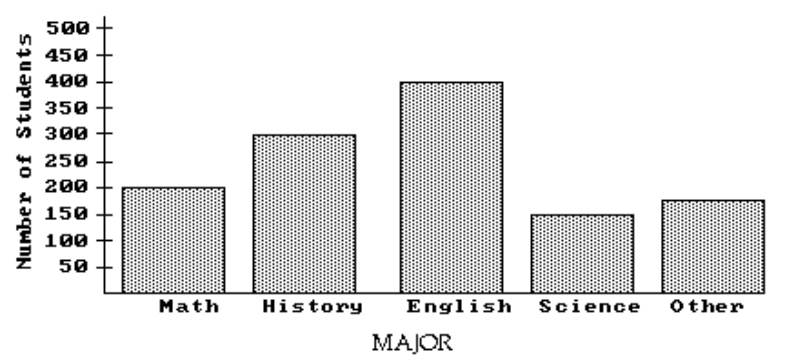
-How many more students are majoring in math than in science?
A) 10
B) 150
C) 100
D) 50
Correct Answer:

Verified
Correct Answer:
Verified
Related Questions
Q16: Use the pictograph to answer the question.<br>-For
Q17: Construct a bar graph to represent the
Q18: Refer to the double-bar graph below
Q19: Refer to the double-bar graph below
Q20: The following table contains information about
Q22: Use the pictograph to answer the
Q23: Use the circle graph to solve
Q24: Use the circle graph to solve
Q25: Refer to the double-bar graph below which
Q26: Find the mean.<br>- <span class="ql-formula" data-value="43,50,32,46,29,50,30"><span