Essay
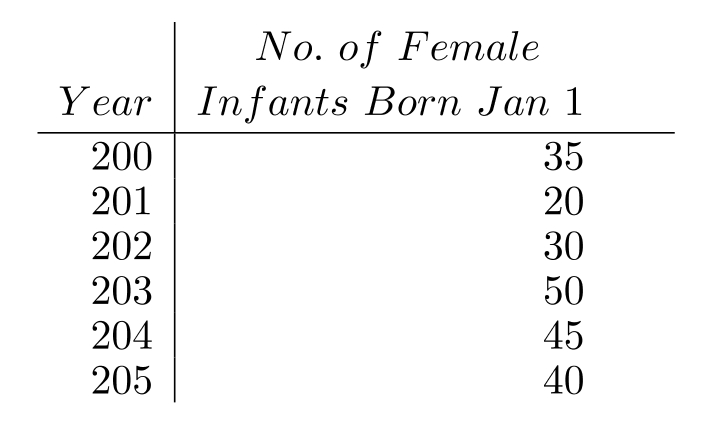
Construct a bar graph to represent the given data.
-The following table shows the number of female infants born at Hospital X on New Year's Day (Jan. 1).
Correct Answer:

Verified
Answers ma...View Answer
Unlock this answer now
Get Access to more Verified Answers free of charge
Correct Answer:
Verified
Answers ma...
View Answer
Unlock this answer now
Get Access to more Verified Answers free of charge
Related Questions
Q12: For the set of numbers, find
Q13: For the set of numbers, find the
Q14: Find any modes that exist.<br>- <span
Q15: Find the probability of the event.<br>-If
Q16: Use the pictograph to answer the question.<br>-For
Q18: Refer to the double-bar graph below
Q19: Refer to the double-bar graph below
Q20: The following table contains information about
Q21: The bar graph below shows the number
Q22: Use the pictograph to answer the