Multiple Choice
Refer to the double-bar graph below which shows the number of male and female athletes at a university over a four-year period. Solve the problem.
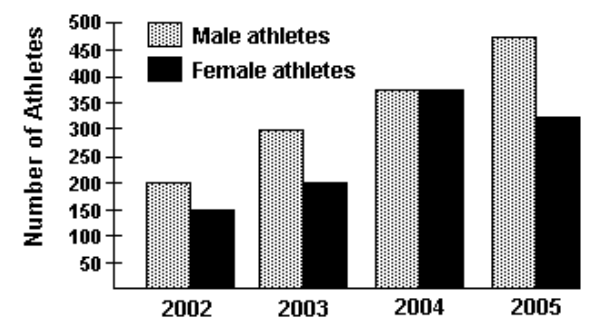
-What was the percent of decrease in the number of female athletes from 2004 to 2005 ?
A)
B)
C)
D)
Correct Answer:

Verified
Correct Answer:
Verified
Related Questions
Q13: For the set of numbers, find the
Q14: Find any modes that exist.<br>- <span
Q15: Find the probability of the event.<br>-If
Q16: Use the pictograph to answer the question.<br>-For
Q17: Construct a bar graph to represent the
Q19: Refer to the double-bar graph below
Q20: The following table contains information about
Q21: The bar graph below shows the number
Q22: Use the pictograph to answer the
Q23: Use the circle graph to solve