Multiple Choice
Use the graph to answer the question.
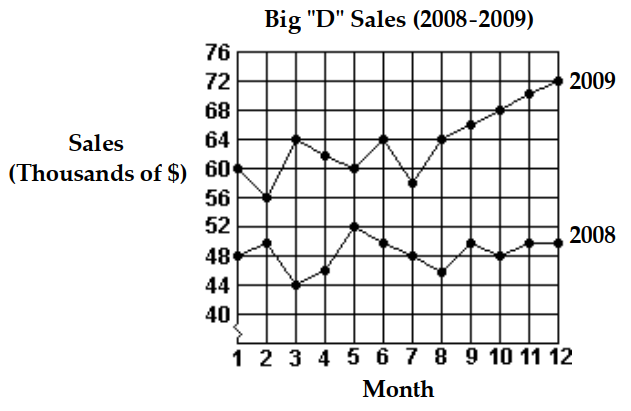
-What was the total increase in sales from 2008 to 2009?
A)
B)
C)
D)
Correct Answer:

Verified
Correct Answer:
Verified
Related Questions
Q147: Use the graph to answer the
Q148: Use the circle graph to solve the
Q149: The bar graph below shows the number
Q150: Make a line graph of the data
Q151: The following stem-and-leaf plot gives the
Q153: The bar graph below shows the number
Q154: Draw a tree diagram for the experiment.
Q155: A deck of cards contains 52
Q156: Determine the quartiles as specified.<br>-The normal
Q157: Find the mean.<br>- <span class="ql-formula" data-value="\$