Short Answer
Use the following figure that shows a firm's isoquant for producing 3,000 units of output and four isocost curves. Labor and capital each cost $100 per unit. 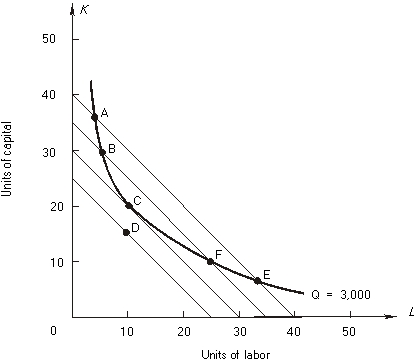
-At point C the firm __________________ the cost of producing 3,000 units of output. The MRTS is _______________ (greater than, less than, equal to) the input price ratio, w/r.
Correct Answer:

Verified
Correct Answer:
Verified
Q41: A firm increases its usage of all
Q42: The following graph shows one of a
Q43: Suppose that when a firm increases its
Q44: A firm is producing 1,000 units of
Q45: The following graph shows a firm's long-run
Q47: The following graph shows a firm's long-run
Q48: Answer the following questions concerning an expansion
Q49: Using the above table, answer the following
Q50: Answer the following questions concerning an expansion
Q51: In the following figure, isoquant I is