Short Answer
The following graph shows a firm's long-run average and marginal cost curves.
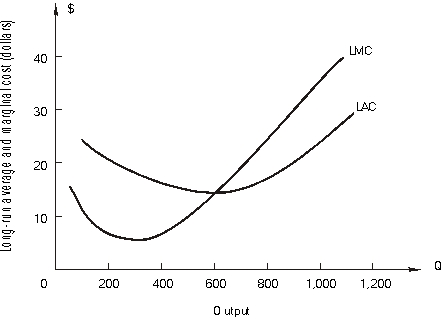
-At any output less than 900, _________ is higher than _________. At any output greater than 900, _________ is higher than _________.
Correct Answer:

Verified
Correct Answer:
Verified
Related Questions
Q42: The following graph shows one of a
Q43: Suppose that when a firm increases its
Q44: A firm is producing 1,000 units of
Q45: The following graph shows a firm's long-run
Q46: Use the following figure that shows a
Q48: Answer the following questions concerning an expansion
Q49: Using the above table, answer the following
Q50: Answer the following questions concerning an expansion
Q51: In the following figure, isoquant I is
Q52: A firm increases its usage of all