Short Answer
The following graph shows a firm's long-run average and marginal cost curves.
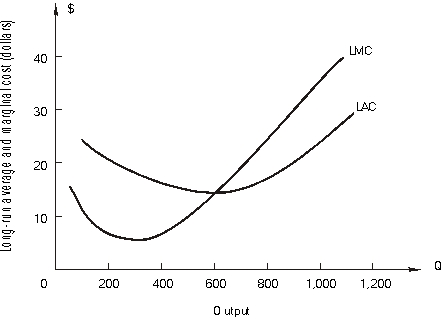
-From zero to 600 units of output __________ exist. Beyond 600, ________________ exist. Suppose the firm decides to build a plant to produce 900 units of output at the least possible cost. After the plant is built the firm is in the short run with short-run average and marginal cost curves of ATC and MC. (ATC and MC are not shown in the figure.)
Correct Answer:

Verified
economies ...View Answer
Unlock this answer now
Get Access to more Verified Answers free of charge
Correct Answer:
Verified
View Answer
Unlock this answer now
Get Access to more Verified Answers free of charge
Q40: Answer the following questions concerning an expansion
Q41: A firm increases its usage of all
Q42: The following graph shows one of a
Q43: Suppose that when a firm increases its
Q44: A firm is producing 1,000 units of
Q46: Use the following figure that shows a
Q47: The following graph shows a firm's long-run
Q48: Answer the following questions concerning an expansion
Q49: Using the above table, answer the following
Q50: Answer the following questions concerning an expansion