Multiple Choice
The following scatterplot shows the relationship between the left and right forearm lengths (cm) for 55 college students along with the regression line, where y = left forearm length x = right forearm length. (Source: physical dataset on the CD.) 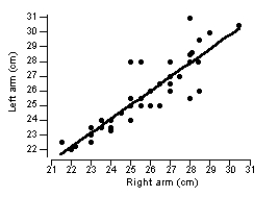 Which is the appropriate equation for the regression line in the plot?
A) = 1.22 + 0.95x
B) = 1.22 -0.95x
C) = 1.22 + 0.95y
D) = 1.22 - 0.95y
Correct Answer:

Verified
Correct Answer:
Verified
Q6: A group of adults aged 20 to
Q7: The correlation between two variables is given
Q8: Use the following information for questions:<br> The
Q9: The following output is for a simple
Q10: Use the following information for questions:<br> A
Q12: Which of the following sets of variables
Q13: A reviewer rated a sample of fifteen
Q14: Use the following information for questions:<br> The
Q15: The value of a correlation is reported
Q16: A regression equation for left palm length