Short Answer
Use the following information for questions:
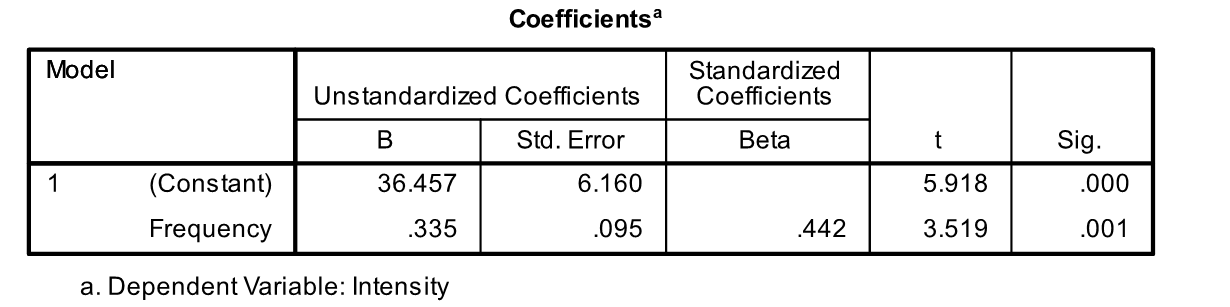
The 25 item "Parenting Hassles Scale" asks parents questions about certain situations in their family. They are asked to rate these situations on (1) how often they occur (frequency), and (2) how much they bother them (intensity). The score system for the frequency was 0-4 points (0 = never, 4 = all the time) and for the intensity 1-5 (1 = not much at all, 5 = very much). If an item received a 0 (zero) for frequency, it automatically received a 0 (zero) for intensity. The two variables, frequency and intensity, were formed by taking the total of the corresponding scores from the two rating scales across the various situations. In a scatterplot, these two variables showed an approximate linear relationship. They were then used to run a linear regression to predict intensity based on frequency.
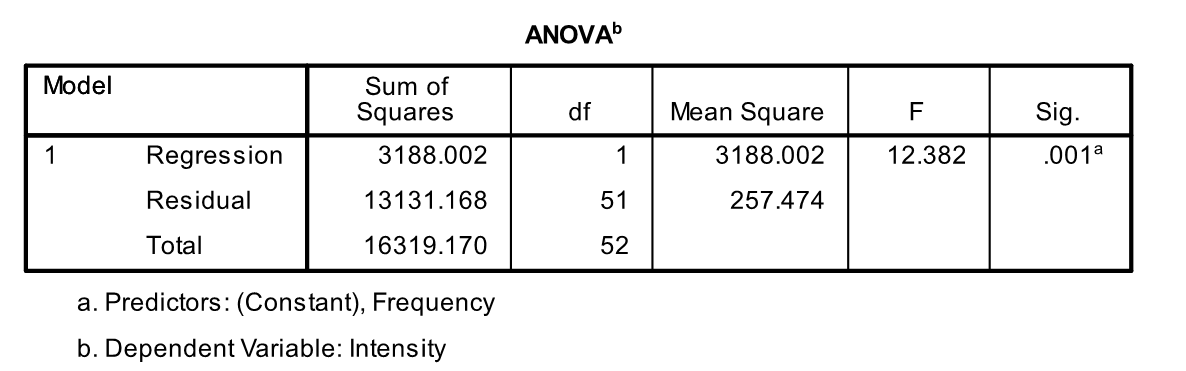
-What is the value of the Sum of Squared Errors for this regression line?
Correct Answer:

Verified
Correct Answer:
Verified
Q3: A researcher found a positive correlation between
Q4: A scatter plot and regression line can
Q5: Use the following information for questions:<br> A
Q6: A group of adults aged 20 to
Q7: The correlation between two variables is given
Q9: The following output is for a simple
Q10: Use the following information for questions:<br> A
Q11: The following scatterplot shows the relationship
Q12: Which of the following sets of variables
Q13: A reviewer rated a sample of fifteen