Short Answer
The following output is for a simple regression in which y = grade point average (GPA) and x = number of classes skipped in a typical week. The results were determined using self-reported data for a sample of n = 1,673 at a large northeastern university.
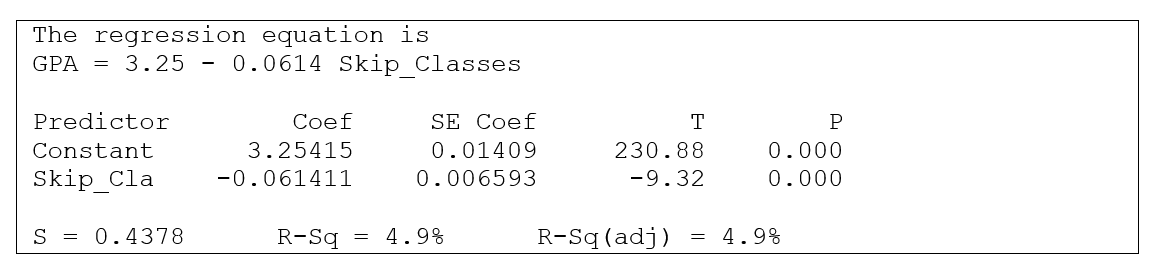 What value is given in the output for R2? Based on this value, explain whether the association between GPA and classes skipped per week is a strong association or a weak association.
Correct Answer:

Verified
R2 = 4.9%. This indicates a wea...View Answer
Unlock this answer now
Get Access to more Verified Answers free of charge
Correct Answer:
Verified
View Answer
Unlock this answer now
Get Access to more Verified Answers free of charge
Q4: A scatter plot and regression line can
Q5: Use the following information for questions:<br> A
Q6: A group of adults aged 20 to
Q7: The correlation between two variables is given
Q8: Use the following information for questions:<br> The
Q10: Use the following information for questions:<br> A
Q11: The following scatterplot shows the relationship
Q12: Which of the following sets of variables
Q13: A reviewer rated a sample of fifteen
Q14: Use the following information for questions:<br> The