Multiple Choice
(a) 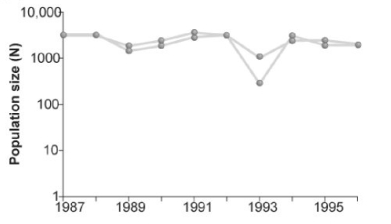
(b) 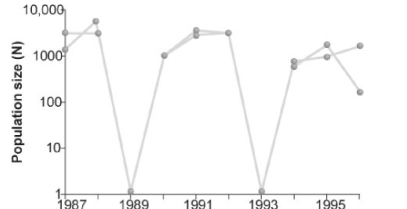
Figure 51.9
-Which of the two graphs in the figure above shows a population of organisms that has a strong population cycle?
A) a
B) b
C) both show identical cycles
Correct Answer:

Verified
Correct Answer:
Verified
Q1: <img src="https://d2lvgg3v3hfg70.cloudfront.net/TB6548/.jpg" alt=" Figure 51.13 -Looking
Q2: <img src="https://d2lvgg3v3hfg70.cloudfront.net/TB6548/.jpg" alt="
Q3: Which of the following is the most
Q4: <img src="https://d2lvgg3v3hfg70.cloudfront.net/TB6548/.jpg" alt=" Figure 51.1 -In
Q5: <img src="https://d2lvgg3v3hfg70.cloudfront.net/TB6548/.jpg" alt=" Figure 51.3 -Looking
Q7: The definition of a generation is<br>A) 20
Q8: What is the primary limiting factor that
Q9: Use the following abstract from Theoretical Population
Q10: (a) Density dependence: Growth rate slows at
Q11: <img src="https://d2lvgg3v3hfg70.cloudfront.net/TB6548/.jpg" alt=" Figure 51.1 -In