Short Answer
Scientists have studied whether one can predict temperature based on the frequency of a cricket's chirps. Consider the following two scatterplots based on data gathered in one study of 30 crickets, with temperature measured in degrees Fahrenheit and chirp frequency measured in chirps per minute:
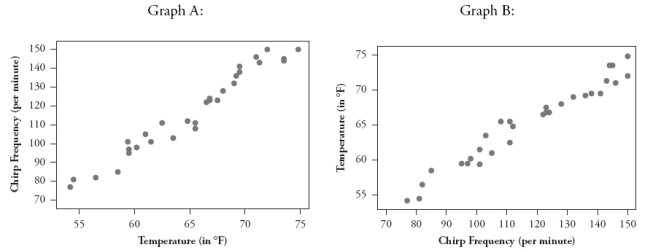 a. If the goal is to predict temperature based on a cricket's chirps per minute, which is the appropriate scatterplot to examine, A or B? Explain briefly.
Consider the following computer output:
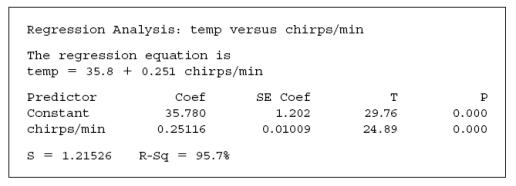 b. Determine the value of the correlation coefficient between temperature and chirp frequency.
c. What temperature would the regression model predict if the cricket were chirping at 110 chirps per minute? Is this prediction an example of extrapolation? Explain briefly.
d. Identify the value of the test statistic for testing whether the population slope coefficient is zero.
e. Produce and interpret a 90% confidence interval for the population slope coefficient.
Correct Answer:

Verified
Correct Answer:
Verified
Q1: A statistician found data in an advertisement
Q3: For the homeowner's utility data studied in
Q4: The following data are the age (in
Q5: A sample of students at a university
Q6: The following data are the age (in
Q7: The following scatterplots display the price vs.
Q8: The following data are the age (in
Q9: It can be shown that the sum
Q10: The following scatterplot displays the rushing yardage
Q11: The following scatterplot displays the rushing yardage