Short Answer
Naturalists recorded the following data on size of islands in the West Indies and number of species of reptiles and amphibians living on the island:
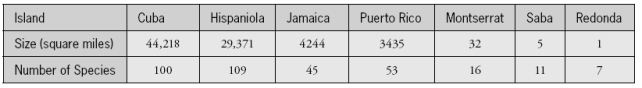 The goal of this study was to develop a model for predicting the number of species from the island size.
a. Which is the response variable in this study?
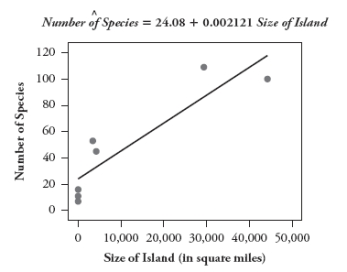
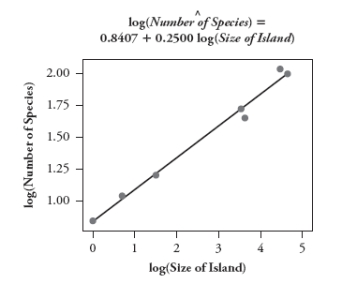
The following scatterplots show least squares lines for predicting number of species from island size, first without a transformation and then taking log (base 10) of both variables:
 b. Which model would you use? Explain your choice.
c. Use the model that you chose to predict the number of species on an island with a size of 2000 square miles.
Correct Answer:

Verified
a. The response variable is the number o...View Answer
Unlock this answer now
Get Access to more Verified Answers free of charge
Correct Answer:
Verified
View Answer
Unlock this answer now
Get Access to more Verified Answers free of charge
Q24: Suppose you record data on these four
Q25: The following scatterplot displays the rushing yardage
Q26: Every month for a period of many
Q27: The following scatterplot displays the rushing yardage
Q28: A statistician found data in an advertisement
Q30: In a recent study of the effectiveness
Q31: The following four scatterplots pertain to a
Q32: A sample of students at a
Q33: A statistician found data in an advertisement
Q34: A sample of students at a university