Short Answer
Every month for a period of many years, a homeowner kept track of several variables related to natural gas and electricity usage in his house, before and after he added a new room to the house. The following scatterplots show the average daily natural gas usage vs. mean temperature for the month and average daily electricity usage vs. mean temperature for the month, respectively.
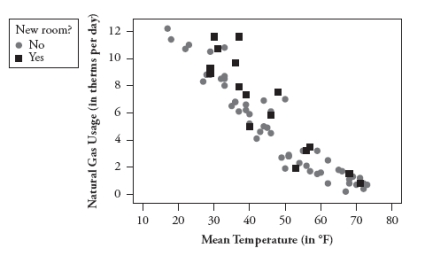
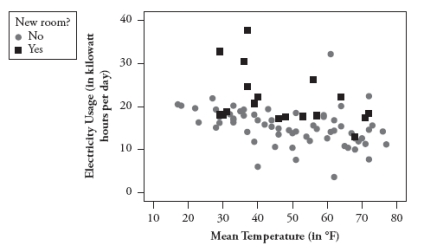 a. Which utility's usage (natural gas or electricity) appears to be more temperature dependent for this homeowner? Explain how you can tell from the scatterplots.
b. Do the scatterplots provide any reason to believe that natural gas or electricity usage (or both) are higher after the extra room is added? Explain how you can tell.
Correct Answer:

Verified
a. Natural gas usage appears to be more ...View Answer
Unlock this answer now
Get Access to more Verified Answers free of charge
Correct Answer:
Verified
View Answer
Unlock this answer now
Get Access to more Verified Answers free of charge
Q21: The following scatterplot displays the number of
Q22: The following scatterplot displays lung capacity (forced
Q23: Suppose for each student in a statistics
Q24: Suppose you record data on these four
Q25: The following scatterplot displays the rushing yardage
Q27: The following scatterplot displays the rushing yardage
Q28: A statistician found data in an advertisement
Q29: Naturalists recorded the following data on size
Q30: In a recent study of the effectiveness
Q31: The following four scatterplots pertain to a