Short Answer
The following scatterplot displays the rushing yardage per game vs. number of rushes for LaDainian Tomlinson in the 2006 National Football League season. Also displayed is the least squares line.
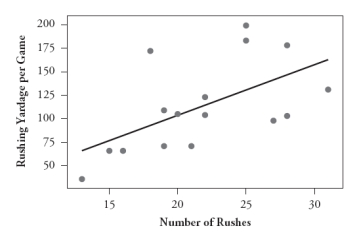 The equation of the least squares line is predicted rushing yards = -3.69 + 5.37 × number of rushes.
The value of r2 is .332.
-Interpret the value of r2 in this context.
Correct Answer:

Verified
The coefficient of determination (r2) tel...View Answer
Unlock this answer now
Get Access to more Verified Answers free of charge
Correct Answer:
Verified
View Answer
Unlock this answer now
Get Access to more Verified Answers free of charge
Q20: The following scatterplots display the age (in
Q21: The following scatterplot displays the number of
Q22: The following scatterplot displays lung capacity (forced
Q23: Suppose for each student in a statistics
Q24: Suppose you record data on these four
Q26: Every month for a period of many
Q27: The following scatterplot displays the rushing yardage
Q28: A statistician found data in an advertisement
Q29: Naturalists recorded the following data on size
Q30: In a recent study of the effectiveness