Short Answer
The following side-by-side stemplot displays the total number of points scored per Super Bowl football game for the first 41 Super Bowls (from 1967-2007), separated according to the first 20 games (19671986) and the next 21 games (1987-2007): 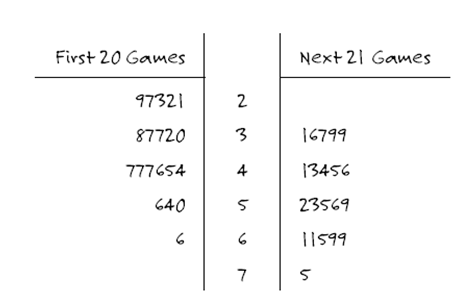
-Does this stemplot provide evidence that Super Bowl games have become more high-scoring over time, more low-scoring over time, or neither? Explain.
Correct Answer:

Verified
This stemplot provides evidenc...View Answer
Unlock this answer now
Get Access to more Verified Answers free of charge
Correct Answer:
Verified
View Answer
Unlock this answer now
Get Access to more Verified Answers free of charge
Q45: Is it possible for the mean value
Q46: The following side-by-side stemplot displays the total
Q47: The following histogram displays the magnitudes of
Q48: The following histograms display the distributions of
Q49: In a study reported in the July
Q50: A trimmed mean is another measure
Q51: The following histograms display the distributions of
Q52: The following table reports counts of the
Q54: The following data are the speaking rates
Q55: In a study reported in the July