Essay
The following histograms display the distributions of percentage of a state's residents who are Mexican, for each region of the country (West, South, Northeast, Midwest). 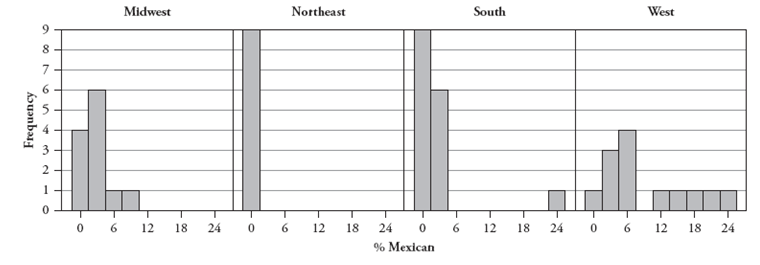
-Which region do you suspect has the smallest standard deviation in these percentages? Explain.
Correct Answer:

Verified
The Northeast has the smallest...View Answer
Unlock this answer now
Get Access to more Verified Answers free of charge
Correct Answer:
Verified
View Answer
Unlock this answer now
Get Access to more Verified Answers free of charge
Q45: Is it possible for the mean value
Q46: The following side-by-side stemplot displays the total
Q47: The following histogram displays the magnitudes of
Q48: The following histograms display the distributions of
Q49: In a study reported in the July
Q50: A trimmed mean is another measure
Q52: The following table reports counts of the
Q53: The following side-by-side stemplot displays the total
Q54: The following data are the speaking rates
Q55: In a study reported in the July