Essay
Figure 11-8
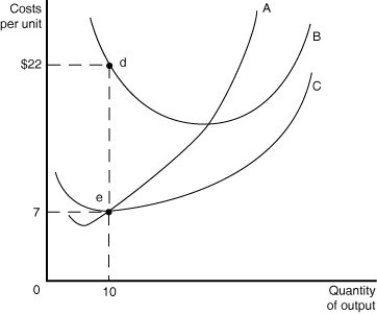
-Refer to Figure 11-8 above to answer the following questions.
a.Identify the curves in the diagram.
A ________ B ________ C ________
b.What is the numerical value of fixed cost when the quantity of output =10?
c.What is the numerical value of variable cost when the quantity of output =10?
d.What is the numerical value of total cost when the quantity of output =10?
e.What is the numerical value of average fixed cost when the quantity of output =10?
f.What is the numerical value of average total cost when the quantity of output =10?
g.On the graph identify the area that represents the total variable cost of production when the quantity of output =10.
h.On the graph identify the area that represents the fixed cost of production when the quantity of output =10.
Correct Answer:

Verified
a.A=Marginal cost curve; B = A...View Answer
Unlock this answer now
Get Access to more Verified Answers free of charge
Correct Answer:
Verified
View Answer
Unlock this answer now
Get Access to more Verified Answers free of charge
Q245: Average fixed cost can be calculated using
Q246: What is the difference between total costs,
Q247: Figure 11-7<br> <img src="https://d2lvgg3v3hfg70.cloudfront.net/TB4193/.jpg" alt="Figure 11-7
Q248: Which of the following statements is true?<br>A)An
Q249: Figure 11-13<br> <img src="https://d2lvgg3v3hfg70.cloudfront.net/TB4193/.jpg" alt="Figure 11-13
Q251: When a firm's long-run average cost curve
Q252: Figure 11-12<br> <img src="https://d2lvgg3v3hfg70.cloudfront.net/TB4193/.jpg" alt="Figure 11-12
Q253: Figure 11-1<br> <img src="https://d2lvgg3v3hfg70.cloudfront.net/TB4193/.jpg" alt="Figure 11-1
Q254: As a firm hires more labor in
Q255: When a firm experiences a positive technological