Multiple Choice
Figure 11-13
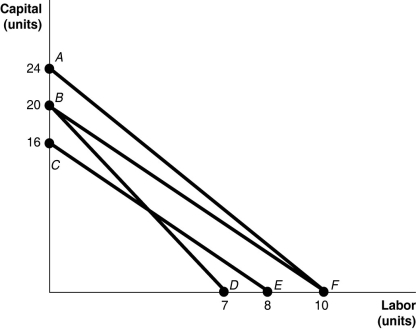
-Refer to Figure 11-13.The lines shown in the diagram are isocost lines.Which of the following shows an increase in the firm's total cost while the price of labor and capital remain unchanged?
A) the movement from CE to BF
B) the movement from CE to AF
C) the movement from BD to AF
D) the movement from BD to CE
Correct Answer:

Verified
Correct Answer:
Verified
Q244: Table 11-7<br> <img src="https://d2lvgg3v3hfg70.cloudfront.net/TB4193/.jpg" alt="Table 11-7
Q245: Average fixed cost can be calculated using
Q246: What is the difference between total costs,
Q247: Figure 11-7<br> <img src="https://d2lvgg3v3hfg70.cloudfront.net/TB4193/.jpg" alt="Figure 11-7
Q248: Which of the following statements is true?<br>A)An
Q250: Figure 11-8<br> <img src="https://d2lvgg3v3hfg70.cloudfront.net/TB4193/.jpg" alt="Figure 11-8
Q251: When a firm's long-run average cost curve
Q252: Figure 11-12<br> <img src="https://d2lvgg3v3hfg70.cloudfront.net/TB4193/.jpg" alt="Figure 11-12
Q253: Figure 11-1<br> <img src="https://d2lvgg3v3hfg70.cloudfront.net/TB4193/.jpg" alt="Figure 11-1
Q254: As a firm hires more labor in