Multiple Choice
Figure 11-12
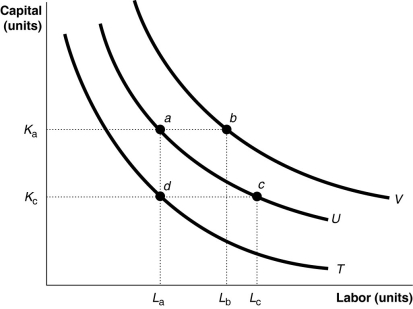
-Refer to Figure 11-12.The movement from isoquant T to isoquant U depicts
A) a change in preferences with regards to input usage.
B) an increase in the cost of production.
C) an increase in output.
D) an increase in labor usage holding capital and output constant.
Correct Answer:

Verified
Correct Answer:
Verified
Q247: Figure 11-7<br> <img src="https://d2lvgg3v3hfg70.cloudfront.net/TB4193/.jpg" alt="Figure 11-7
Q248: Which of the following statements is true?<br>A)An
Q249: Figure 11-13<br> <img src="https://d2lvgg3v3hfg70.cloudfront.net/TB4193/.jpg" alt="Figure 11-13
Q250: Figure 11-8<br> <img src="https://d2lvgg3v3hfg70.cloudfront.net/TB4193/.jpg" alt="Figure 11-8
Q251: When a firm's long-run average cost curve
Q253: Figure 11-1<br> <img src="https://d2lvgg3v3hfg70.cloudfront.net/TB4193/.jpg" alt="Figure 11-1
Q254: As a firm hires more labor in
Q255: When a firm experiences a positive technological
Q256: Which of the following statements is false?<br>A)When
Q257: If average product is decreasing, then marginal